��4.jpg)

 Save
Save Print
Print
/2026/banner_1768393451.jpg)
The 22nd China Ferro-alloys International Conference, host ed by Ferro-Alloys.com, will be held on 20 May to 22 May, 2026 in Beijing city, China. We sincerely invite you jointly explore the development ferroalloys trend in 2026. Why Attend?
[Ferro-Alloys.com] JMS- Tshipi Half Year Report 31 December 2025
Operating and Financial Review
During the half-year period, Jupiter’s principal activities were its investment in Tshipi é Ntle Manganese Mining Proprietary Limited (Tshipi), which operates the Tshipi manganese mine in South Africa, and the marketing of its share of Tshipi manganese ore.
The Tshipi manganese mine is a long-life, open pit manganese mine with an integrated ore processing plant located in the Kalahari Manganese Field (KMF) in the Northern Cape Province of South Africa.
|
|
Unit |
HY2026 |
HY2025 |
HY2024 |
|
Sales |
Tonnes |
1,705,196 |
1,721,442 |
1,692,523 |
|
Average FOB cost of production |
US$/dmtu |
2.25 |
2.36 |
2.01 |
|
Average CIF price achieved (HGL) |
US$/dmtu |
3.99 |
4.06 |
3.56 |
|
Average FOB price achieved (HGL) |
US$/dmtu |
3.24 |
3.02 |
2.90 |
Note: FOB = Free on Board, CIF = Cost, Insurance Freight, HGL = high-grade lump
Table 1: Summary of operating and financial information for Tshipi
Mining and Production
Overall mining volumes for the period totalled 6.3 million bank cubic metres (bcm), representing a 20% decrease on the comparative half-year. This decrease was mainly due to seasonal rain and equipment availability. Graded ore was down against the comparative half-year, only due to elevated mining activity in HY2025 versus HY2026.
Total manganese ore produced during the period at Tshipi was 1.7 million tonnes. Of this, 1.4 million tonnes comprised of high-grade ore, with a further 0.3 million tonnes of low-grade ore processed during the period. Tshipi commenced FY2026 by building some low-grade ore stockpiles whilst production schedules allowed. With market conditions improving in the second quarter of FY2026, Tshipi then prioritised high-grade production.
Logistics and Sales
Tshipi achieved 1.7 million tonnes of sales during the period, supported by logistics volumes of the same amount, on par with the prior half-year.
Additional South African road haulage was activated during the period, due to derailments and planned Transnet shutdowns.
Sales volumes remain on target to meet the business plan on an annualised basis for the financial year.
Financial Review
Jupiter recorded a consolidated result for the half-year of $16,192,024 profit after tax (HY2025: profit of $13,983,749 after tax), including a share of net profit from its investment in Tshipi of $16,168,749 (HY2025: $15,429,353). Jupiter’s cash at 31 December 2025 was $11,427,370 (FY2025: $13,157,448).
For HY2026, Tshipi recorded a net profit after tax of ZAR369 million ($32.4 million) (HY2025: ZAR366 million; $30.9 million). Tshipi’s net profit was marginally higher than the previous half-year period due to an increase in manganese prices offset by a decrease in mining and production volumes.
Tshipi’s cost of production reduced to US$2.25 per dmtu (FOB) for the half-year, against US$2.36 for the prior comparative period.
Tshipi ended the half-year period with ZAR1.5 billion in cash ($137.3 million) (FY2025: ZAR1.5 billion, $128.8 million).
Strategic Progress
Jupiter continued to advance its five-year Company Strategy during the period, making measured progress across all core initiatives.
Ongoing business improvement and cost efficiency remains a core focus at Tshipi. Given that logistics represents the largest component of Tshipi’s cost base, efforts during the period have been directed towards improving logistics capacity and flexibility. This included securing a milestone 10-year MECA 3 Agreement with Transnet early in HY2026, and continued engagement to unlock incremental rail opportunities. These initiatives enhance Tshipi’s cost competitiveness and export resilience.
Jupiter has also progressed work on assessing the appropriate sustainable production rate at Tshipi, with updated long-term mine planning continuing during the period. Any future increase in production will be carefully timed to align with market conditions, with a focus on delivering sustainably and profitably higher output.
Targeted consolidation opportunities within the Kalahari Manganese Field remain under active consideration. The acquisition of manganese interests by Exxaro Resources Limited (Exxaro) represents an important strategic development and aligns with Jupiter’s vision for consolidation in the region. Post HY2026, Exxaro announced it has satisfied all conditions for the acquisition of various manganese mining investments in South Africa including a 50.1% ownership interest in Tshipi and a 19.99% share in Jupiter from Ntsimbintle Holdings. Formal completion of the transaction is expected to occur on 27 February 2026.
In parallel, Jupiter continues to support Tshipi in advancing sustainability initiatives that deliver both strong environmental, sustainability and governance (ESG) outcomes and clear commercial benefits. During the period Tshipi announced its achievement of Level 1 Broad-Based Black Economic Empowerment status, joining only one other miner in the KMF to have attained Level 1. In addition, Jupiter continues to progress its studies into the potential production of battery-grade manganese from low-grade ore. The commissioning of a high purity manganese sulphate monohydrate (HPMSM) pilot plant during FY2025 has enabled further flowsheet refinement, product validation and ongoing customer engagement. Jupiter remains disciplined in advancing this opportunity, with a focus on appropriately de-risking volume and pricing assumptions to guide future study phases of the project.
Jupiter continues to execute its strategy with discipline and flexibility, positioning Jupiter to respond to market conditions and opportunities to deliver long-term shareholder value.
Tshipi Financial Summary
A summary of the Statement of Profit or Loss and Other Comprehensive Income and Statement of Financial Position of Tshipi for the half-year periods are presented below on a 100% basis, in its functional currency.
The summary was prepared by Tshipi, and constitutes non-IFRS (International Financial Reporting Standards) information. Non-IFRS information is not subject to audit or review.
The summary is included to provide users of this report a whole view of the financial position of Tshipi, as Jupiter accounts for its investment in Tshipi on an equity accounting basis (refer Note 8 to the Consolidated Financial Statements).
|
Statement of Profit or Loss |
HY2026 (ZAR’000) |
HY2025 (ZAR’000) |
|
Revenue |
3,900,450 |
4,105,486 |
|
Cost of sales |
(3,320,683) |
(3,561,447) |
|
Gross profit |
579,767 |
544,039 |
|
Other income |
5,181 |
18,181 |
|
Administrative expenses |
(8,524) |
(7,586) |
|
Impairment of property, plant & equipment/loss on derecognition |
- |
(16,130) |
|
Other operating expenses |
(26,845) |
(39,801) |
|
Profit from operating activities |
549,579 |
498,703 |
|
Net finance income |
(4,415) |
57,845 |
|
Profit before royalties and taxation |
545,164 |
556,548 |
|
Royalties |
(39,250) |
(54,552) |
|
Profit before taxation |
505,914 |
501,996 |
|
Income tax expense |
(137,200) |
(135,790) |
|
Profit for the period |
368,714 |
366,206 |
|
Jupiter share of profit (49.9%) |
183,988 |
182,737 |
|
Jupiter share of profit ($’000) |
16,169 |
15,429 |
|
Statement of Financial Position |
||
|
Cash and cash equivalents |
1,521,596 |
1,651,303 |
|
Trade and other receivables |
747,926 |
658,450 |
|
Other current assets |
1,216,938 |
1,387,344 |
|
Property, plant & equipment |
4,985,410 |
4,269,349 |
|
Other non-current assets |
215,090 |
214,364 |
|
Total assets |
8,686,960 |
8,180,810 |
|
Trade and other payables |
721,468 |
639,271 |
|
Tax and royalties payable |
(461) |
99,773 |
|
Other current liabilities |
61,113 |
52,365 |
|
Deferred tax |
1,296,335 |
1,170,084 |
|
Other non-current liabilities |
160,132 |
173,681 |
|
Total liabilities |
2,238,587 |
2,135,174 |
|
Net assets |
6,448,373 |
6,045,636 |
|
Share capital and share premium |
321,359 |
321,359 |
|
Retained earnings |
6,127,014 |
5,724,277 |
|
Total Equity |
6,448,373 |
6,045,636 |
Manganese Market Overview and Outlook
The Fastmarkets manganese ore semi carbonate CIF index (36.5% Mn CIF Tianjin) was quoted at US$4.15/dmtu on 29 December 2025, up from US$3.83/dmtu on 27 June 2025 (an increase of US$0.32/dmtu). The Fastmarkets manganese ore semi carbonate FOB index (36.5% Mn FOB Port Elizabeth) was quoted at US$3.46/dmtu on 29 December 2025, up from US$3.20/dmtu on 27 June 2025 (an increase of US$0.26/dmtu).
The reported CIF price at half-year end was lower than the five year historical average of US$4.30/dmtu CIF Tianjin however on an FOB basis the price was higher than the five year historical average of US$3.35/dmtu FOB Port Elizabeth. This difference is attributable to lower freight rates during the period compared to the historical five year average of circa US$34.50/tonne from Port Elizabeth to Tianjin.
Manganese ore prices displayed a modestly increasing trend through the half-year period predominantly led by strong manganese ore consumption from downstream ferroalloy plants and restocking activities in the latter part of the period.
Manganese ore exports increased on a year-on-year comparative basis predominantly due to the return of steady state exports from the majority owned South32 Limited manganese operation at Groote Eylandt during the current six month period. An increase in exports from South Africa was also noted and attributable to both improved market conditions compared to the comparative six month period as well as an on-going improvement in rail logistics capacity in the country.
Increased manganese ore exports were mainly transferred to the Chinese market, as well as to a lesser extent the Indian market. Downstream consumption by manganese alloy plants in China, including other factors such as an increase in manganese rich slag production, contributed to the consistent upward price movements on both portside and seaborne prices through the period. Manganese ore prices were further supported by seasonal stockpiling and reported reduced shipments of high-grade ore in the latter part of the period.
US dollar denominated seaborne prices were also supported by the strengthening of the Chinese yuan against the US dollar through the period, contributing to more favourable import prices for Chinese purchasers. On the contrary the strengthening of the South African rand against the US dollar, unfavourable to South African producers, further supported an uptick in US dollar denominated seaborne offer prices from producers.
The reportedly reduced high-grade ore shipments as well as lower reported high-grade port inventories compared to long term historical levels translated into an increase in high-grade ore prices initially, and with the widening price differential, semi carbonate prices were able to leverage off these price increases whilst consumption of semi carbonate ore in product blends was promoted due to more favourable cost considerations.
Total manganese ore inventories at major ports in China trended sideways through the period, averaging 4.4 million tonnes. The higher export volumes did not directly translate into higher port inventories as ore volumes were supported by the previously mentioned higher consumption and seasonal restocking, in addition to an increase in exports to unconventional ports in China not included in port stock statistics.
Further downstream, manganese alloy prices mostly hovered within a narrow range of RMB 5,500 – 5,800/tonne (ex-works with tax Inner Mongolia SiMn 6517 basis) through the period. Many manganese alloy producers in the country continue to be challenged by a prolonged environment of low margins attributable to supply outpacing demand and a buildup of stocks as a result.
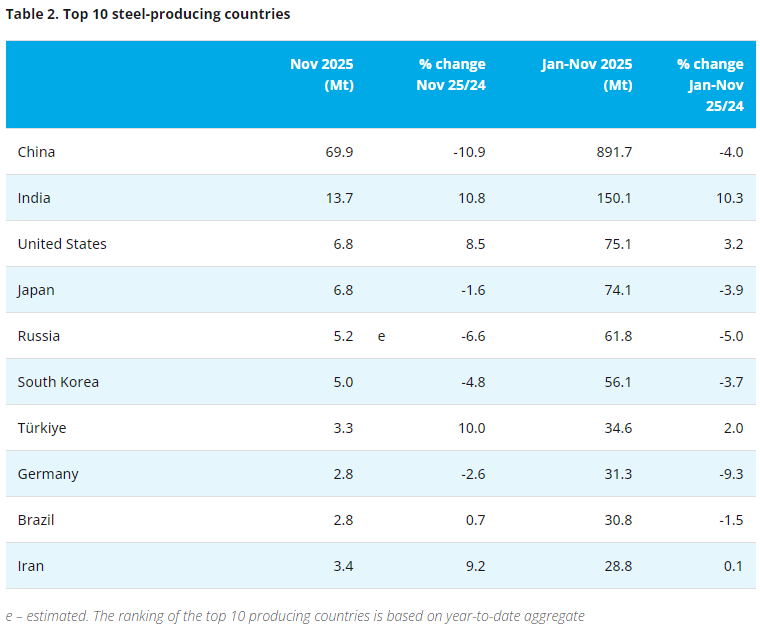
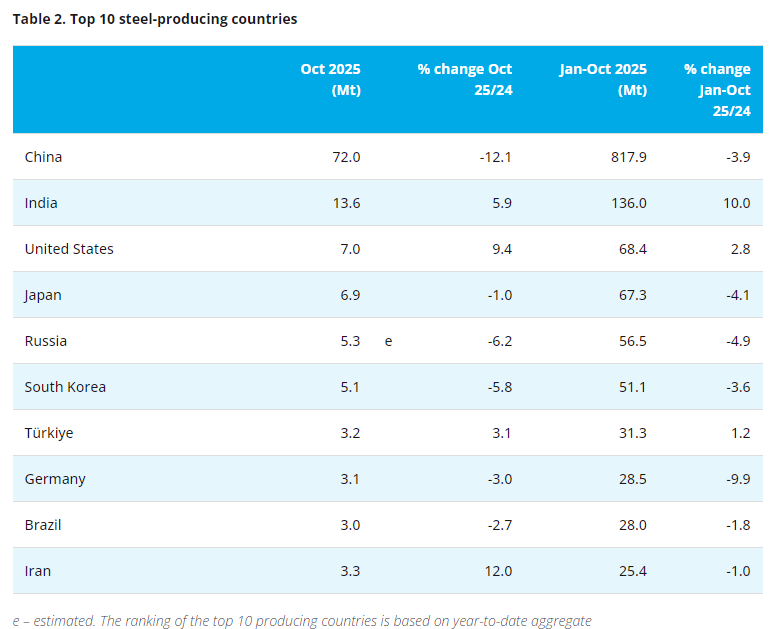
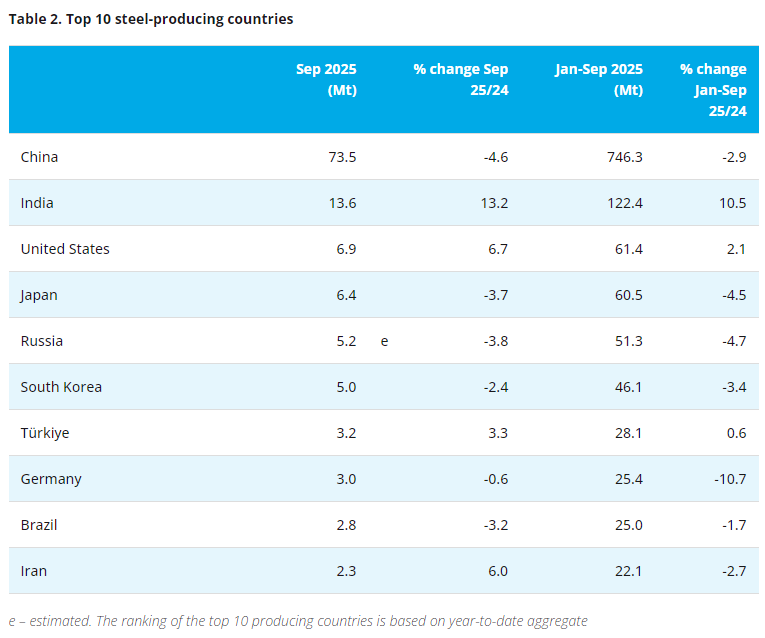
As per the Worldsteel Association, global crude steel production for the six month period declined on a year-on-year comparative basis attributable to a notable decline in crude steel production in China. The rest of the world (i.e. excluding China) experienced growing crude steel production during the current period compared to the comparative period, with the predominant positive contribution coming from India.
Strong growth in India continues to be fuelled by railway infrastructure, urbanisation and renewable energy projects. Growth in the country is forecast to continue increasing in the long term as more steel mills are commissioned to support the growing domestic demand.
Whereas in China, the construction sector and more notably the continued downturn in real estate property has had a negative impact on Chinese crude steel production. Whilst the manufacturing sector, including the appliance and automobile subsectors, has supported demand for flat steel products this has been insufficient to offset the declining construction sector. The 15th Five-Year Plan will be announced in 2026 and market participants will be looking at the central government’s policies indicating how overall economic reliance is expected to shift from real estate construction to more advanced manufacturing, green energy and technological self-reliance and the impact thereof on the steel sector.
- [Editor:tianyawei]
 Daily News
 Research
 Magazine
 Company Database
 Customized Database
 Conferences
 Advertisement
 Trade
Trade


/2026/�ňDƬ_20260129145906.jpg)


Tell Us What You Think